Extreme Testing Ansible Specification
- Gautam Divgi (Unlicensed)
AIC Resiliency Testing Ansible Specification
Conceptual Diagram
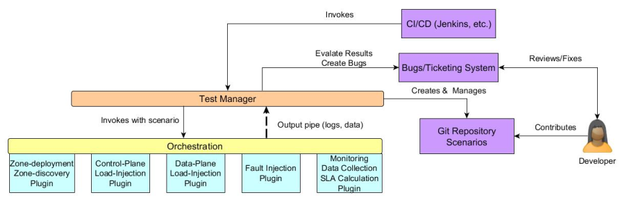
Principles of the Framework
- Agentless Execution: All orchestration of tests across the site have to be agentless. Having agents running in a site that are conduits to failure injection is not optimal.
- Non-deterministic Execution: Resiliency and performance are non-deterministic measures. There is no hard success or failure. Load and failure injection need to be handled using mathematical models.
- Extensibility: The ability to support multiple deployment, discovery, load & failure injection and metrics/SLA calculation mechanisms via plugins.
Zone Discovery (Synchronous)
The deployment discovery will be needed to uncover the details of the underlying h/w and s/w deployment of an openstack zone. The information can either be supplied manually, retrieved via automated tools or a mix of both.
Inputs
A plugin alias / python class that can be loaded to retrieve the data
Outputs
A map of the deployment that consists of the following items (more can be added)
- Servers
- Rack
- Ports
- IPs
- MACs
- IPMI details
- Memory, CPU and storage configuration
- SSH access key
- Compute/Control indicator [may not be needed with cLCP]
- Racks
- IPMI
- Servers attached
- TOR switch information (whatever that may be)
- SSH access key
- Openstack VMs
- Label (Openstack, Cassandra DB, Contrail-xxx, etc.)
- Openstack service
- NIC/IP attached
- DBs used
- Storage used
- MAC
- Ports
- Memory/CPU allocated
- SSH access key
- Switches
- Mgmgt IP/Ports
- MACs
- SSH access key
- Routers
- Mgmgt IP/Ports
- MACs
- SSH access key
- Storage Devices
- Mgmt IP/Ports
- MACs
- SSH access key
- LUN information
- Openstack
- An OpenRC file/data
Current focus will be on fields marked in bold+italics above. The output will be used by load injection, fault injection and data collection/monitoring tools.
Control Plane Load Injection (Synchronous)
The purpose of the control plane load injector is to run a "characteristic workload". A "characteristic workload" can have the following:
- A set of transactions (in our case HEAT templates – but could vary)
- A ramp-up model
- A sustenance model
- A ramp-down model
The control plane load injection step will last for the entire duration of the test. The duration of the test can be defined either by the number of transactions or by a time duration.
Inputs
- Zone Discovery data
- Openstack/OpenRC information
- Transaction set along with YAMLs/Python files
- Ramp-up model
- Sustenance model
- Ramp-down model
Outputs
- Transaction success/failure
- Transaction start and end time
- Transaction phase (ramp-up, sustenance, ramp-down)
This can be an interface directly to openstack rally.
Data Plane Load Injection
N.A. – not in scope at present
Fault Injection (Event Driven)
The fault injector will create artificial faults in the system. Fault injection has the following characteristics:
- It is randomized or deterministic
- Randomized takes a form like <inject fault between iteration 10 and 100> or <between 500 seconds and 1000 seconds>
- Deterministic takes a form like <inject fault at this iteration or after so many seconds>
- It can take multiple faults to be injected and specify a sequence with which they will be injected.
- A fault recovery mechanism – if possible (and not automated)
The faults should be specified using a command line like syntax e.g. crash –service=keystone –scope=all-servers, kill –server=<servername>, packetloss –interface=<some i/f> --server=<servername>
Inputs
- Zone discovery data – all of it
- Faults to be injected
- Injection model (randomized/deterministic)
- Recovery mechanism
- Recovery model (randomized/deterministic)
Outputs
- Fault injection time
- Fault recovery kick-in time
This plugin could interface directly with os-faults
SLA & Metrics
Metrics Gathering
Gathering metrics is important to ascertain what is happening in the environment. The metrics gathering will be a fairly complex set of python code that will need to be scp'ed into the target machines to retrieve data. The data will then be stored and input into the SLA modules for analysis.
Input
- Counters to measure
- Frequency of measurement
Output (In JSON)
- Resource ID/Tree
- Counter values
- Measurement iteration
- Measurement timestamp
SLA Calculation
SLA plugin are needed to compute the adherence to KPI from the metrics gathering. These metrics are essentially mathematical in nature. They will be used to provide success/failure on the tests. There are primarily two types of SLA metrics
- Stream based: These metrics work on points and not on historical data. E.g. mean/variance/EWMA computation.
- Data based: These metrics work on historical data points. E.g. percentile computation, time series analysis, etc.
Input
- Metrics data from metrics modules
Output
- KPI values
- Test Pass/Fail indication